

Your Black Friday ads are almost ready. If visits rise but orders don’t, should you check the traffic or the checkout page? If shoppers add items to their carts but few purchases appear, are they getting stuck—or is tracking missing orders? And even if orders grow, how much remains per order after product, shipping and advertising costs?
For a store under six months old, start with your store reports, GA4 and optional Clarity recordings. Follow platform-specific setup steps, check paid orders and investigate mobile shopping problems. Real examples and cost calculations will help you decide whether to fix a page, adjust an offer or hold off on increasing ad spend.
BFCM means Black Friday Cyber Monday. This checklist covers Shopify, WooCommerce, Wix, and BigCommerce. Follow your platform's route and connect GA4 to see incoming visits. Where the app or plugin route below is available, try Clarity to watch a mobile shopping visit.
Tool and interface details checked against official documentation on October 31, 2026. Published customer cases checked on November 1, 2026; sources and scope are stated below.
Choose tools by the first thing you need to see
For a new store preparing BFCM, give each tool one simple job:
| Tool | What you can see | First useful check |
|---|---|---|
| Your platform’s built-in orders and reports | Orders, products sold, payment status, and—in supported reports—visits and conversion | Open an order and confirm its payment status; find your top-selling product |
| Google Analytics 4 (GA4), standard version | Visits and shopping actions sent by your store's integration | Find your own visit and product interactions in the Realtime report |
| Microsoft Clarity, optional | Recordings of visits, clicks, and scrolling on supported store pages | Watch your own phone visit, then inspect a few customer visits to the same page |
Your store already records orders and products sold as purchases happen. Clarity adds collection of page interactions after installation; it cannot replay earlier visits. Available store reports depend on the platform and plan.
GA4's standard version and Microsoft Clarity are free. GA4 gives you an initial collection check; Clarity lets you watch how a page behaves. A recording reconstructs supported page interactions. Google Analytics, Clarity FAQ
For Clarity, Shopify, WooCommerce, and Wix offer an app or plugin route. BigCommerce operators can use the built-in dashboard and basic GA4 connection for this checklist.
First, find the data your store already has
Open your order list and choose the last seven complete days. Note the number of paid orders, the products purchased, and any obvious payment or fulfillment problems. Keep test orders separate.
For a store without last year’s BFCM history, this gives you a starting reference. During the event, compare equivalent periods—such as today up to noon against another day up to noon—and record when you changed an offer, email, or ad. A half-finished day will naturally look smaller than a complete one.
Check the payment status before calling an order a sale you have collected. Sales dashboards and order lists can include different statuses. The following platform-specific steps show where that distinction matters.
Shopify: open the dashboard, then check an order
- In Shopify admin, open Analytics and choose your dates.
- Under Analytics → Reports, open Conversion rate breakdown to see sessions, carts, checkout, and completed checkout. Open Total sales by product to see which products are selling.
- Open Orders, filter Payment status = Paid, and select an order. Check its payment record, discount, shipping charge, and purchased items.
Shopify’s main Analytics features are available across subscription plans, and the dashboard updates in about a minute. Its sales reports can include pending, unpaid, or canceled orders, so the sales total is not a substitute for checking payment status. Shopify Analytics, dashboard, sales reports
You’re ready when: you can find the checkout progression, your leading product, and one order’s payment status. The funnel’s step percentages use all sessions as their denominator; they are not automatically the rate from the previous step. Funnel definitions
WooCommerce: start with Orders and Products
- In WordPress admin, open WooCommerce → Orders. Open one order and check its status and payment details. Processing normally means payment received; On hold needs payment confirmation. Check the payment record for cash-on-delivery or manually changed orders.
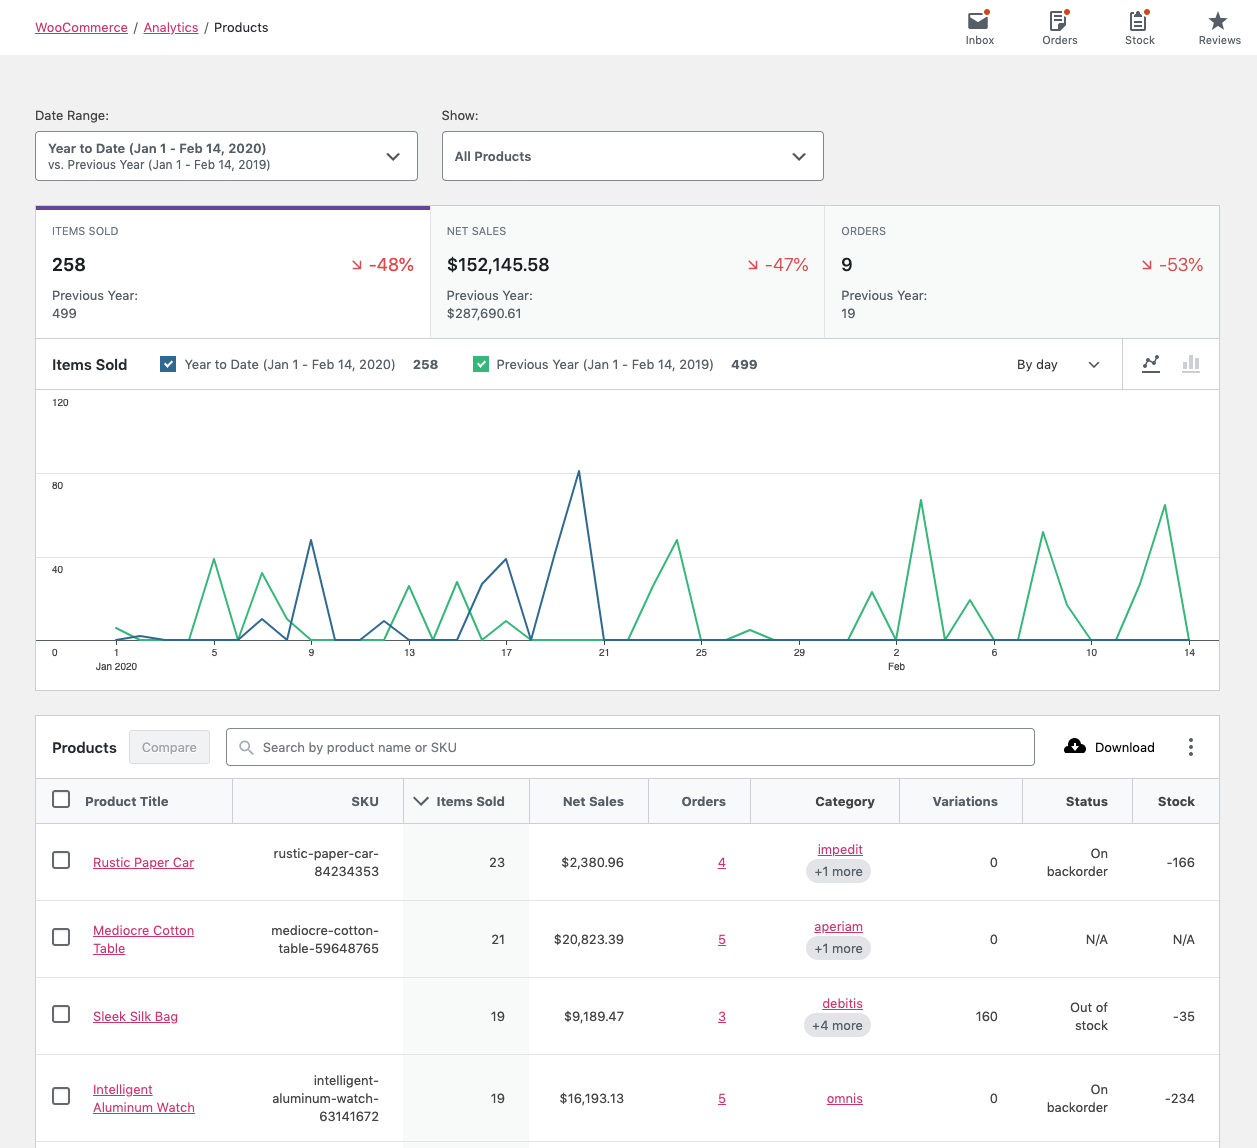
- Open Analytics → Products, select your dates, and leave All Products selected. The default order shows the most Items Sold first; Net Sales appears alongside.
- To check where an individual order came from, open it and look for Order attribution. The Orders list can also show an Origin column.
WooCommerce's standard Analytics reports are included with WooCommerce. Their figures depend on selected statuses and dates, so confirm payment in the order itself. Order attribution describes the source associated with a recorded order; it does not give you a complete traffic or abandoned-cart funnel. If attribution is disabled, its setting is under WooCommerce → Settings → Advanced → Features → Order Attribution. Enabling it starts collection going forward. Order statuses, product report, reporting settings, order attribution
You’re ready when: you can identify a purchased product and check an order’s payment and available source information. Blank attribution is a data gap, not proof that the customer arrived directly.
Wix: find your visit in Real-time
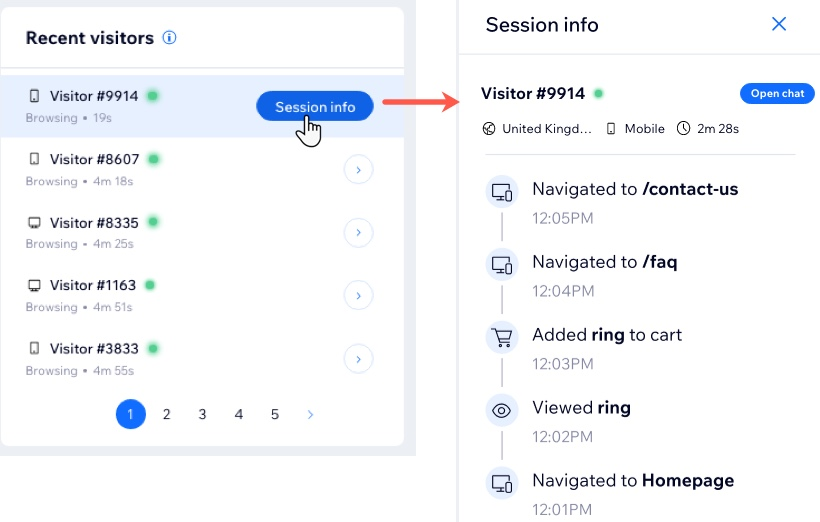
- Open Analytics → Real-time. Visit the store on your phone, allow the relevant analytics cookies, and add a product to the cart. In Recent visitors, find the visit and open Session info. The activity feed can show product views, cart additions, checkout, and orders.
- Open Orders and inspect a recent order's items and payment status.
- Open Store Analytics, in the dashboard's Analytics area under Sales. Choose your dates. In Products, use Sort by → Quantity; in Conversion funnel, select Mobile to inspect phone visits.
Regular Wix Analytics reports update about an hour after an event; Real-time is a separate view. Its Store sales measure includes unpaid orders that have not been canceled and does not deduct refunds, so confirm payment in Orders. Real-time instructions, Store Analytics, reporting times
You’re ready when: you can find your test visit, check an order, and identify the products selling. A report still processing is not evidence that the visit or order was lost.
BigCommerce: use the existing overview
- Open Orders → View and inspect a recent order’s status and payment details.
- Open Analytics → Overview and choose your dates.
- Review Visits, Orders, Conversion Rate, and Purchase Funnel. Top Products lists five products by revenue; for units sold, open Analytics → Merchandising → Products and sort by QTY Sold.
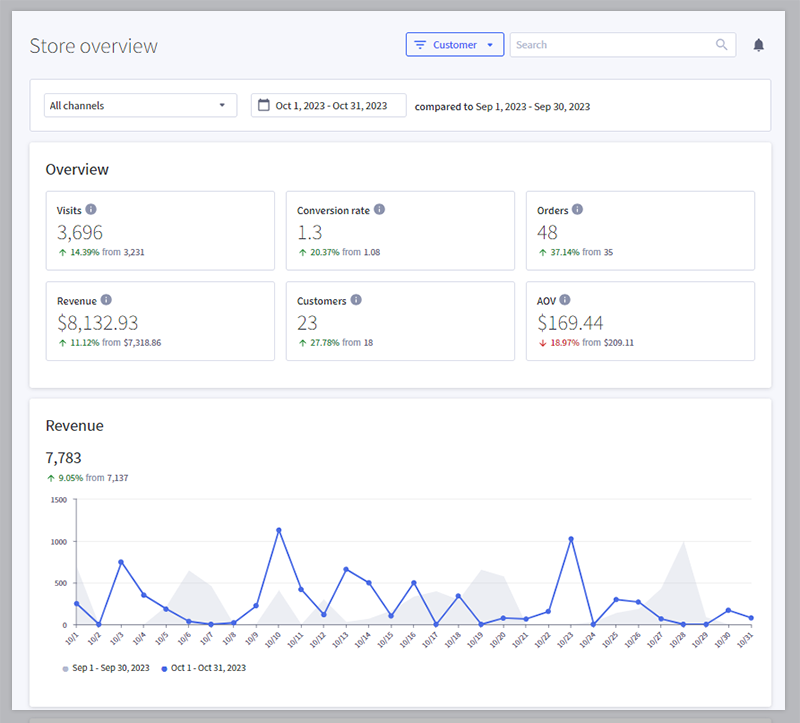
The same overview includes Top Visits by Origin for traffic sources. Most BigCommerce analytics reports update in under a minute. If the dashboard is unavailable or empty, check report permissions and that Collect data for my business is enabled. Keep order payment records as your reference: the store funnel excludes orders created manually in the admin. Overview, product report, analytics settings
You’re ready when: you can find an order, the products selling, and a purchase step to investigate. Use the built-in reports for this checklist; a custom or headless storefront needs separate tracking checks.
Connect GA4 and find your first visit
For your first session with GA4, aim to see data arriving. Your platform's integration can record supported shopping actions for you.
If GA4 is already connected, go straight to the Realtime check below. Use one integration for the same GA4 destination; adding another can send duplicate data.
Create the destination, then connect your platform
- Sign in to Google Analytics. For a new account, choose Start measuring and follow the setup. With an existing account, use Admin → Create → Property.
- Name the property after your store and set its reporting time zone and currency to match your store reports. Complete the business details.
- Add a Web data stream for your published store URL. Keep its Measurement ID, which starts with G-, handy. Google's setup instructions
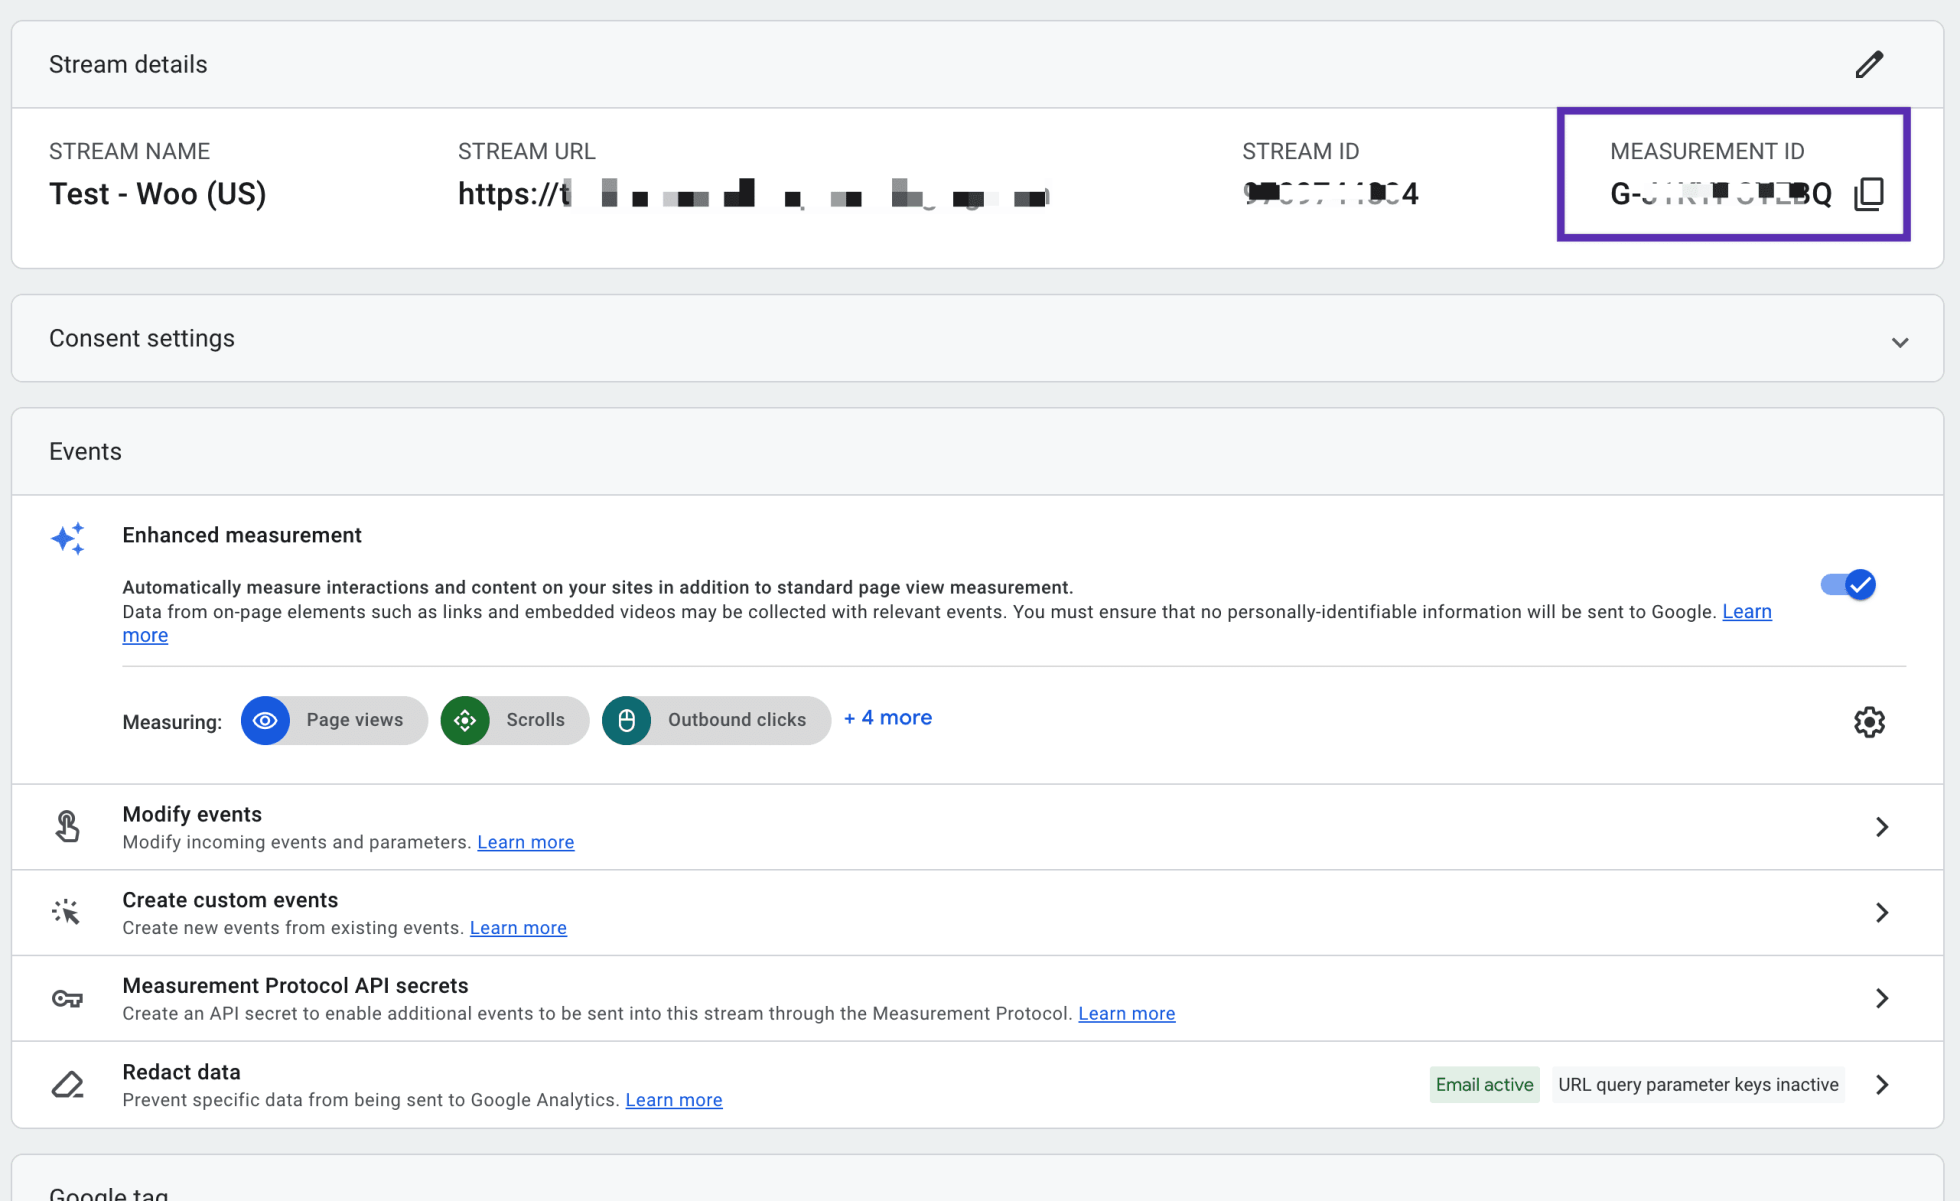
Then follow just your platform's row:
| Platform | Shortest supported setup |
|---|---|
| Shopify | Open the official Google & YouTube app. Under Overview → Just want to set up Google Analytics 4, choose Get started, connect your Google account, select your store's GA4 property, then Connect → Confirm. Connecting GA4 alone does not require Merchant Center. Instructions |
| WooCommerce | Install and activate the official Google Analytics for WooCommerce plugin. Open WooCommerce → Settings → Integration → Google Analytics, enter the G- ID, enable Product Detail Views, Add to Cart Events, Checkout Process Initiated, and Purchase Transactions, then save. Instructions |
| Wix | Requires a Premium site with a connected domain. In GA4's Web stream, open Enhanced measurement settings and disable Page changes based on browser history events and Site search, as Wix directs. In Wix, open Marketing Integrations → Google Tag → Connect → Add Google Tag ID, enter the G- ID, and Save. Instructions |
| BigCommerce | Open Settings → Data Solutions → Google Analytics 4 → Connect. Enter the G- ID and connect. This route supports standard Stencil storefronts with Optimized One-Page Checkout; custom checkout needs separate checks. Instructions |
Check whether data is arriving
During a quiet period, visit the published store on your phone while logged out of its admin. Allow the relevant analytics cookies through the store's consent prompt, open a product, and add it to the cart.
In GA4, open Reports → Realtime. Look for your recent visit and the Event count by Event name card. Event names are simply labels for actions:
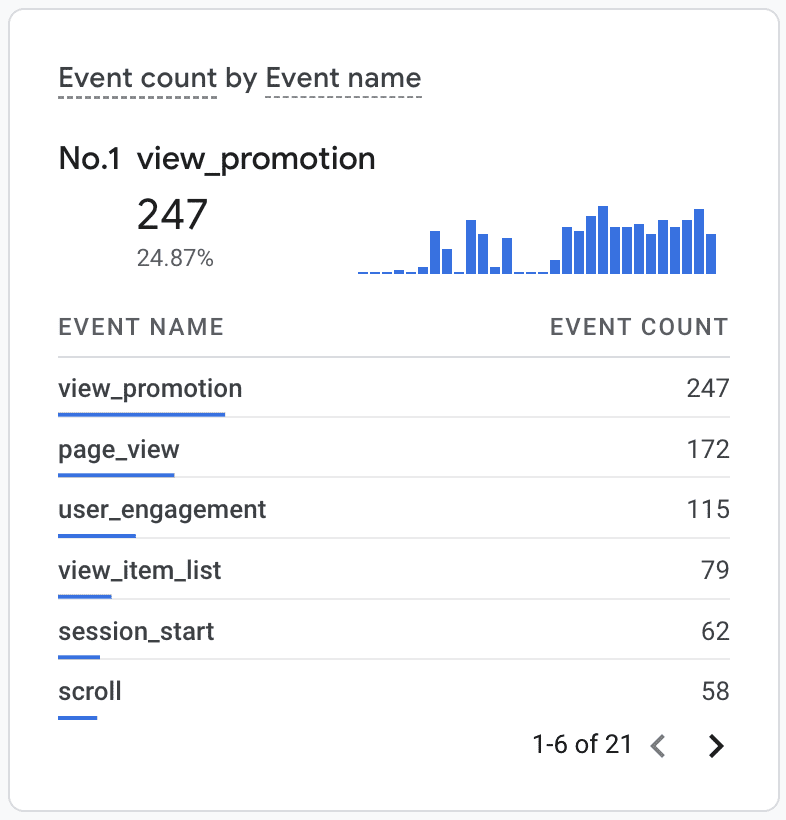
| Event | What happened |
|---|---|
| page_view | A page was viewed |
| view_item | A product detail page was viewed |
| add_to_cart | A product was added to the cart |
| begin_checkout | Checkout began |
Seeing the relevant events after your test is your first completion mark. The card also counts other visitors' actions if they are browsing at the same time. Page views alone confirm basic collection; also look for the product and cart events to check the ecommerce integration. Realtime report
Initial collection can take about 30 minutes to start. Many standard reports take 24–48 hours to process. If Realtime stays empty, check the selected property, saved connection, consent choice, and whether the browser blocked tracking. For WooCommerce, make sure you tested while logged out of the administrator account. Data collection check, WooCommerce troubleshooting
When you later complete a test order, also look for purchase. Test-mode behavior varies by integration; on WooCommerce, purchase tracking requires the shopper to return to the order-received page after payment. Use the store's order record to confirm payment. You now have a useful first result: the integration is sending visits and shopping actions.
Use Clarity to watch a visit to your store
Use Clarity for a concrete question: Can someone choose a size on their phone? Does a promotion cover the add-to-cart button? Is the delivery explanation easy to find?
A new store can learn from its own test visit before it has enough customer traffic for a reliable pattern.
Install it through your platform
| Platform | What to do |
|---|---|
| Shopify | Install Microsoft Clarity: AI Insights from the Shopify App Store. Open Go to app settings, switch on Clarity JS, and Save. Return to the app and refresh if prompted. |
| WooCommerce / WordPress | Open Plugins → Add New Plugin, install and activate Microsoft Clarity, then Sign in. Select your store’s project and Continue, or choose New project. |
| Wix | Open Apps → App Market, find Microsoft Clarity, and choose Add to site. Sign in, then connect your project or add a new one. Wix requires a registered domain for this integration. |
Use the project for the correct store, and follow your existing cookie-consent setup. Keep privacy masking enabled; customer inputs should remain hidden. Installing the tool alone does not complete consent configuration. Shopify instructions, WordPress instructions, Wix instructions, consent integrations, masking
Find your first recording
- On your phone, visit the published store as an ordinary shopper. Follow its consent prompt and allow the relevant analytics cookies for this test.
- Open the BFCM product, select a variant, add it to the cart, and look for delivery information. Note the time and product URL.
- In Clarity, open Recordings. Live recordings can show current visits; look for your test around that time. Leave time for data to arrive—Shopify’s Clarity instructions advise allowing a few hours for the dashboard to fill.
- Once recordings have been collected, open Filters → User info → Device → Mobile. Under Path → Visited URL, filter to the product page. Using Contains with its distinctive path can include visits with campaign parameters.
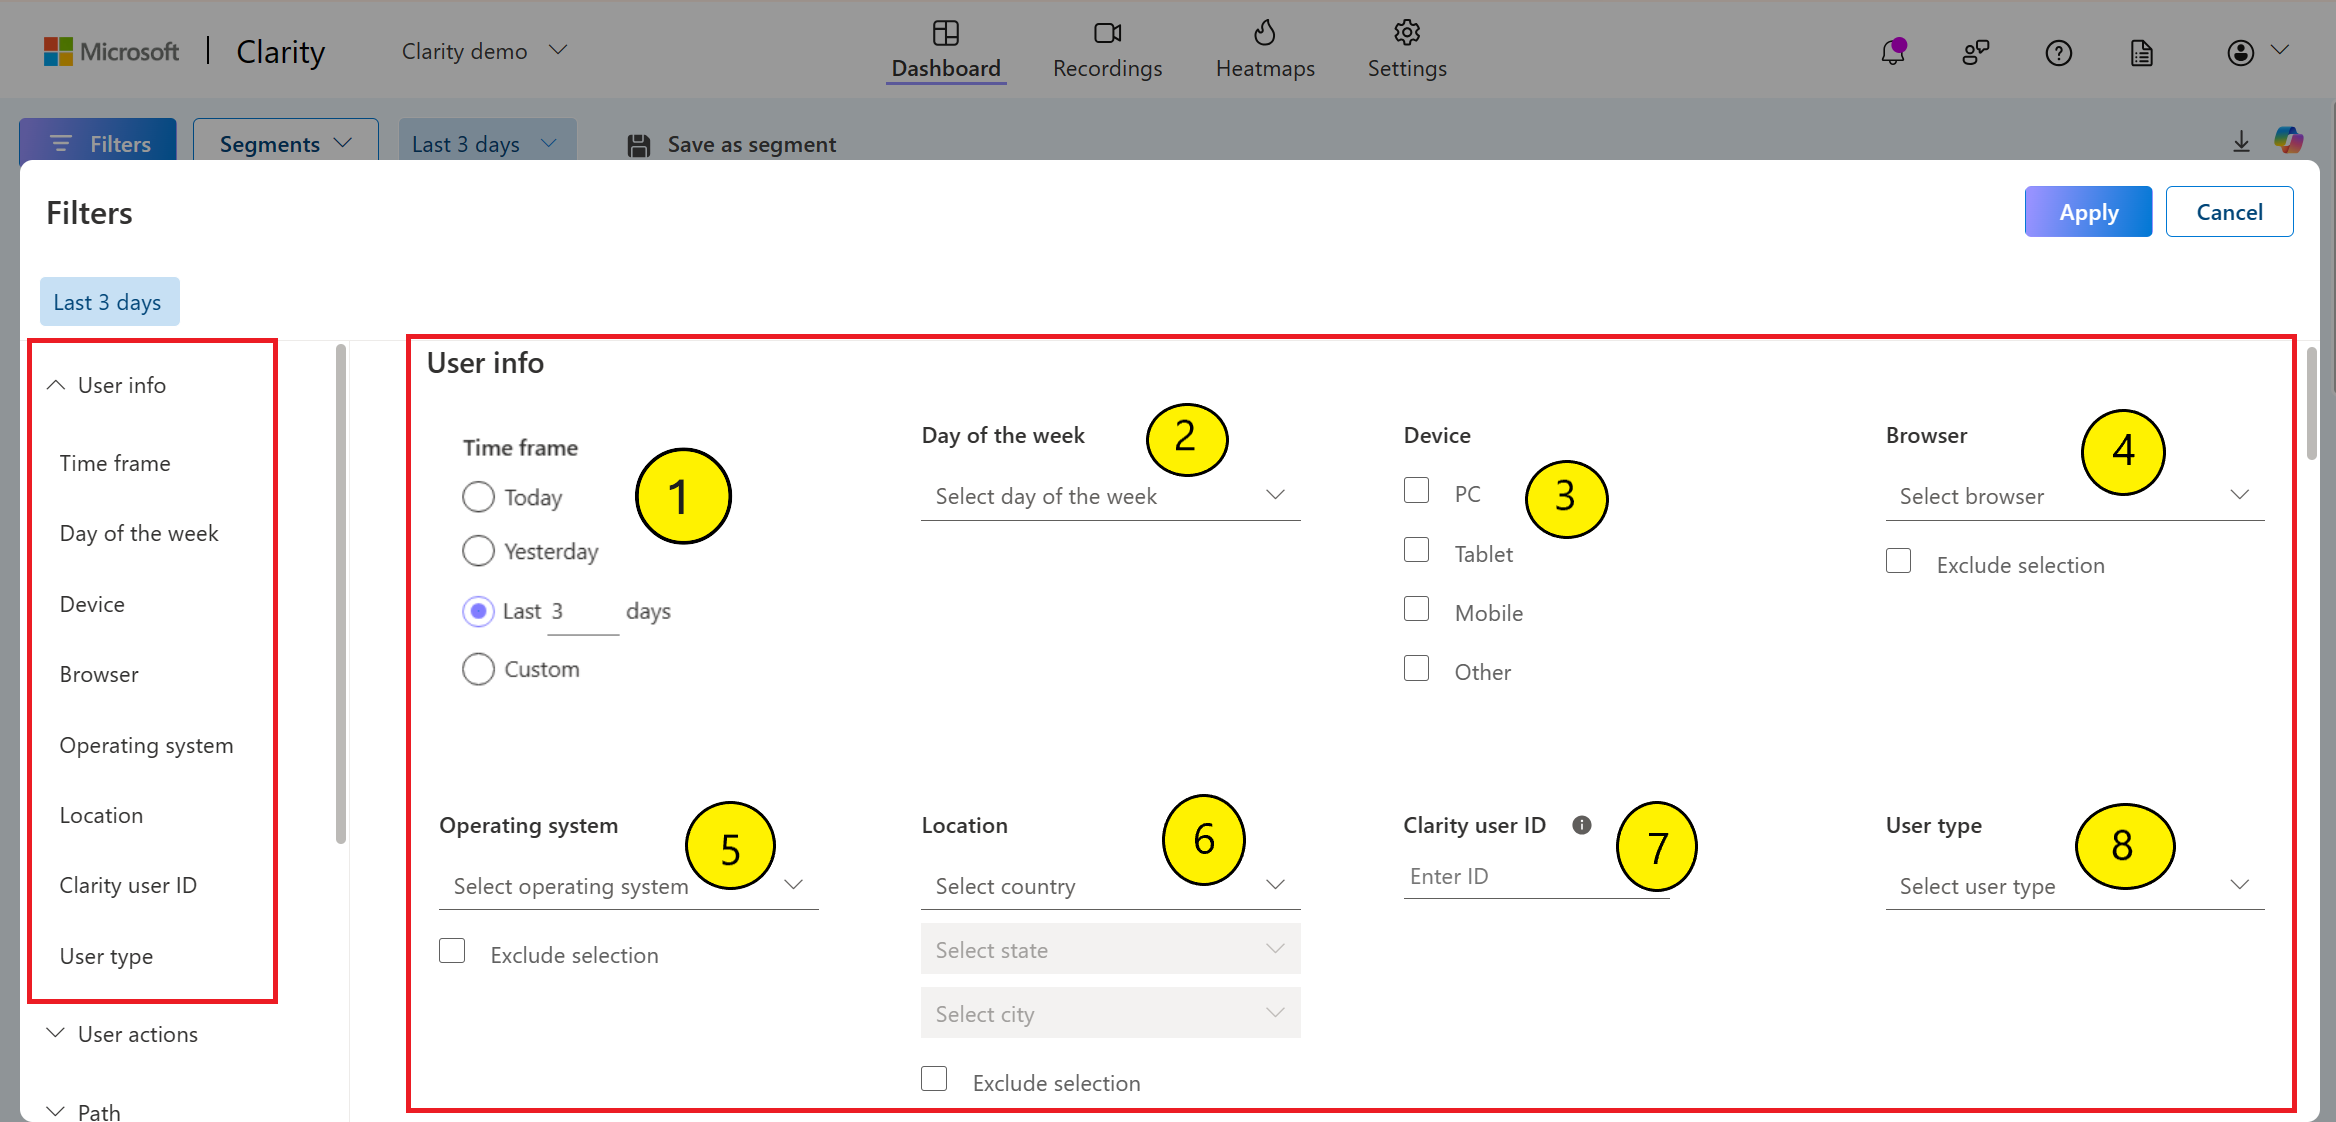
- Watch a few visits and choose one problem you can reproduce yourself.
For a cart drawer that opens without changing the URL, watch the add-to-cart interaction within the product-page recording. It may not have a separate cart-page visit to filter. The URL-filter steps above apply to collected recordings; live recordings support a smaller set of filters. Live recordings, recording filters, URL filters
If no visit appears, first check the store/project, saved installation settings, consent choice, and whether you tested the published site. Allow for reporting delay. Adding a second installation of the same tool can make diagnosis harder.
A recording of your own visit confirms that this collection path works. It does not establish how all customers behave. Keep using recordings as clues, especially when your store has little traffic.
Turn a recording into a small fix
| What you notice | Check it yourself | Possible change after confirmation |
|---|---|---|
| Repeated taps around size options | Select every available size on your phone; check for an overlay or missing feedback | Remove the obstruction or make the selected size clear |
| People scroll around delivery information | Look for the delivery estimate and shipping charge before checkout | Put a short delivery explanation near the purchase controls |
| A popup appears during product selection | Repeat the same path and timing | Delay the popup or change where it appears |
After a change, repeat the same phone visit and confirm that the interaction works. Later, check customer visits and sales for a broader pattern.
Heatmaps can help once you have visits to inspect, but a few clicks are a weak basis for a redesign. Clarity has no minimum traffic requirement for heatmaps; the practical limitation is how much your sample can tell you. Heatmap documentation
Place one order before the promotion goes live
Follow your main campaign link on a phone. Confirm the advertised product and offer are visible, choose an item, apply the discount, check shipping, and complete an appropriate test order. Then find that order in your store admin and verify its items, total, and payment status.
Use your platform’s documented test-order procedure. Test-mode orders may be omitted from reports. A small real purchase can incur payment fees; label it so it is not mistaken for a customer sale. Shopify’s test-order guidance
Check the actual checkout yourself. Clarity does not guarantee a complete checkout recording: Shopify’s documented checkout tracking involves Plus, and embedded third-party payment content may not be visible. Shopify coverage, Clarity compatibility
Your first useful result is concrete: you can complete the purchase and find the corresponding order. If payment fails, keep the time, device, payment method, and displayed error for whoever handles checkout support.
Check that a purchase works and is recorded
One page_view does not establish working purchase tracking. Choose a promoted product and record the time, device, order ID, and outcome of these checks:
| Action | What to verify | First check if it fails |
|---|---|---|
| View a product and successfully add it | GA4 shows view_item and add_to_cart; cart variant and quantity are correct | Plugin options, consent, and duplicate integrations |
| Enter checkout from the cart, then test an enabled express route | begin_checkout appears and the actual route works | Express buying may skip the cart; not every path needs add_to_cart |
| Complete a platform-supported test purchase | Backend payment status is correct; purchase appears if the integration supports that test mode | Test exclusions, payment return, and report processing |
| Compare the same order's amounts | Discounted product subtotal, shipping, tax, and currency agree separately | Do not compare a tax-and-shipping-inclusive payment directly with GA4 product revenue |
| Reopen the confirmation page | Reporting does not treat the same order as a new transaction | Save the order ID and screenshots; ask the integration owner to inspect transaction_id and duplicate sending |
Order IDs should be nonempty, unique per order, and stable for repeat reporting of that order. Google uses transaction IDs for web purchase deduplication. You do not need to add tracking code yourself: give the integration owner the order ID, time, and reproduction steps. Google transaction ID guidance
Reconcile the test order after standard reports finish processing. If payment exists in the backend but not GA4, check date range and timezone, consent or blocking, payment return, and page loading. Test orders may legitimately be excluded. Do not add another tag to fill the gap or demand 100% browser-tracking coverage across all visitors.
Label campaign links so you know where visits came from
Your BFCM emails, social posts, and ads may all lead to the same product. Give external campaign links consistent UTM labels before launch so you can distinguish the visits later.
For an email product link, for example:
https://example.com/products/gift-box?utm_source=newsletter&utm_medium=email&utm_campaign=bfcm_2026&utm_content=hero_button
Source identifies the referrer; medium identifies the channel type; campaign names the promotion; content distinguishes a creative or button. Keep these values beside the landing page, offer, and launch time in a simple sheet. Use consistent spelling. Open the final link on your phone and check that redirects preserve the intended product and offer.
After processing, open GA4 Reports → Acquisition → Traffic acquisition. Look at Session source / medium, then Session campaign. Navigation can vary with your report collection. UTM labels identify traffic; they do not guarantee complete order attribution. Google campaign links, Traffic acquisition

If your ads or email platform already apply tracking, check those settings before adding conflicting parameters. Do not tag internal navigation with campaign UTMs or put customer names or emails in links.
Keep one daily sheet you can actually use
A spreadsheet is enough. Record the reporting period in one business timezone, the extraction time, and any changes you made. Label unavailable numbers “missing” and unfinished processing “pending,” rather than entering zero.
| Question | Where to look and what to record | Comparison and next check |
|---|---|---|
| Where did visits come from? | GA4 Traffic acquisition: source, campaign, sessions | Compare complete equivalent periods; inspect new channels before the whole-store total |
| How far did shoppers get? | Your platform's existing funnel: visits, cart additions, checkout starts, completed checkouts; note unavailable reports | Keep one platform's definitions and split mobile from desktop; do not build a user funnel by dividing GA4 event counts |
| How many orders were paid? | Paid orders in the order admin, with tests separate | Check cancellations, unpaid orders, and payment failures; a purchase event is not proof of collected payment |
| Which product deserves more promotion? | Units sold and available inventory for the promoted SKU | Check stock and dispatch capacity before increasing its budget |
| What remains after advertising? | Store revenue, actual ad spend, product and fulfillment costs | Watch total and per-order contribution; label costs not yet billed as estimates |
| Is the promotion creating later problems? | Refunds, overdue shipments, and support reasons | Address immediate problems, then compare order groups with equal follow-up time |
A practical contribution calculation: discounted product revenue plus customer shipping charges, minus refunds, product costs, actual shipping, packing and picking, payment fees, extra return-handling costs, and advertising. Divide by the original paid-order count for contribution per order. Reconcile refunds and recovered inventory costs separately to avoid double deductions; keep tax receipts separate. This balance still has to cover salaries, rent, and other fixed costs, so it is not net profit.
If advertising cannot be reliably linked to individual products, start with an estimated store-wide contribution for the same complete period. Do not invent precise SKU acquisition costs, or add Meta, Google, and GA4 attributed revenues together as if they were separate sales.
Use the last seven complete days as an initial baseline. During BFCM, compare the same elapsed hours and note changes to offers and traffic sources. Always keep counts beside percentages: one fewer purchase among five checkout visits changes the rate by 20 percentage points. That alone does not establish a broken page.
Four changes to investigate before changing your strategy
Visits increase, but orders do not follow
First confirm the pattern in paid orders. Then identify the new channel, region, and landing page. If existing channels are stable, a larger share of new traffic may explain the lower overall rate; it does not justify redesigning the store.
Open the actual campaign link. Check whether the ad's promise, product, price, and offer match the destination. Correct a confirmed mismatch in the creative or page. If reporting is still processing, keep the conclusion open. Follow that channel's own visits and purchases, not just the whole-store conversion rate.
Shoppers add products but rarely start checkout
Test the cart and checkout buttons on your phone, including coupons, shipping thresholds, stock messages, and popups. Fix a reproducible obstruction first. If the path works, inspect relevant cart recordings for shoppers searching for cost information.
Check express buying too: shoppers can bypass the ordinary cart. If paid orders are healthy, fewer users taking that path need not indicate a loss. After a fix, repeat the same path and follow cart, checkout, and payment counts using consistent definitions.
Mobile purchases fall while desktop stays steady
Check mobile orders and payment records first to rule out a drop visible only in analytics. Test the store's common phone browsers, ordinary checkout, and enabled wallets, including the return to the store after payment.
Clarity helps on pages it can capture; it does not replace payment testing. Act on a reproducible payment failure without waiting for more traffic. If you only have a small change in order counts and no fault to reproduce, keep observing before stopping all mobile ads.
Orders rise, but less money remains after advertising
Check stacked discounts, product mix, delivery regions, refunds, and actual ad spend. Complete the cost sheet above so revenue growth does not hide a shrinking contribution per order.
If an offer combination has confirmed negative contribution, stop increasing its budget while evaluating a smaller discount, different shipping terms, or another promoted combination. When ad costs cannot be allocated reliably, work with total spend and offers rather than declaring a particular SKU unprofitable.
Honor offers already promised to customers. After changes, track orders, contribution, stock, and fulfillment together. Before increasing another product's budget, confirm that it is available, can ship on time, and can still support the acquisition cost of additional orders.
Change your checks before, during, and after BFCM
| Stage | Priority | Useful output |
|---|---|---|
| First setup | Check existing tools and permissions; connect one GA4 integration; add Clarity for a concrete page question | Integration list, campaign-link sheet, and known data gaps |
| Before launch | Test main mobile buying paths, discounts, tax, shipping, payments, and orders; reconcile after processing | Test records, confirmed fixes, and unresolved issues; installed does not mean verified |
| During the sale | Prioritize actual payments, offer errors, ad spend, available stock, and overdue shipments | Timestamped problem and change log; fix technical faults promptly and wait for comparable data on business trends |
| After the sale | Compare channels, products, and buying steps after processing; update refunds and actual costs later | What was fixed, which offers to retain, and which conclusions still lack evidence |
Two days can cover basic setup and a test, but neither report completion nor enough orders to assess performance is guaranteed. Give refunds equal follow-up time too—for example, 14 days after each order, or longer for categories with longer return cycles. Newly placed orders with no refunds yet are not evidence of better quality.
Two real cases: what the teams saw and changed
These customer accounts were published by Microsoft Clarity in August and May 2024, respectively. Neither is established as a store under six months old or a Black Friday experiment. Use them for the investigation method. Results are customer-reported; the articles do not provide full sample sizes, measurement windows, or controlled-test data.
Félix & Norton: shoppers reached checkout but left without buying
Canadian cookie retailer Félix & Norton saw substantial checkout drop-off. Google Analytics and customer feedback had not explained it. Clarity recordings and heatmaps helped the team identify checkout design problems. They removed an unnecessary step, clarified instructions, and improved loading and navigation. The case reports 25% lower checkout abandonment during peak gifting season and a 38% conversion-rate increase—not percentage-point changes. Several things changed together. Microsoft Clarity: Félix & Norton
Try this before BFCM: when shoppers start checkout without completing a purchase, follow the same path on your phone. Look for repeated steps, confusing instructions, or pages that take too long to respond. Compare your test with relevant visits that Clarity can actually capture. Fix one confirmed obstacle, then repeat the test. If your platform prevents checkout replay, use the phone test and order records; missing recordings do not establish that checkout works.
Record the change time. For your follow-up, compare equal periods with the same device filters and similar traffic sources, including checkout starts and completed purchases. A new store can verify that an obstacle is gone before it has enough orders to judge a conversion trend.
Shiny & Diski: shoppers used the price filter, but many never saw it
For tire retailer Shiny & Diski, agency Turum-burum found that a frequently used price filter was visible to only 64% of users. After moving it higher, Clarity maps indicated that approximately 90% saw it, with increased use. That is about 26 percentage points more visibility. The case also reports a 12.5% overall conversion increase after a broader redesign; that result cannot be assigned to this move alone. Microsoft Clarity: Turum-burum / Shiny & Diski
Check your promoted product page: can a mobile shopper find the size options, delivery information, or specifications needed to buy? Try it yourself, then use recordings and a scroll heatmap to check whether visitors reach that section. If people appear to be searching and the information is genuinely hard to find, move that one block somewhere easier to see.
After the change, check discoverability first, then related interactions and add-to-cart activity. A few visits are clues for investigation, not grounds to redesign the whole page because some shoppers did not scroll to the bottom.
Your BFCM checklist is complete when you can do these things
- Find a paid order and check its items, discount, shipping, and total.
- Find the products selling, using a clearly stated reporting period.
- See your visit and shopping actions in GA4 Realtime.
- Complete the promoted purchase on a phone.
- If you installed Clarity, find a test visit and inspect one relevant product page.
- Label campaign links and find their source after processing.
- Keep a daily sheet of paid orders, spend, contribution, and available stock.
- Write down one confirmed problem, the change made, and how you will recheck it.
For a new store, these checks make the first data useful. Start with the promoted product and your own phone; the next decision should come from something you can actually see.
Comments
Share experience or ask a question. Comments are plain text; any external link is automatically marked nofollow.
No comments yet.